Snowflake resource alerts delivered to Slack using Apache Nifi

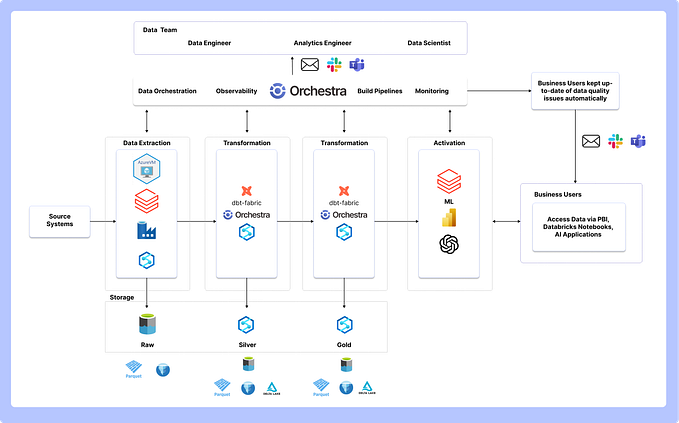
As a Solutions Engineer working at Snowflake, I am often asked by customers and prospects about active resource monitoring. Snowflake is a consumption based model so monitoring resource usage is always a topic of interest for customers getting used to the platform. Snowflake provides Resource Monitors to notify you when a warehouse or account limit has been reached but you may want to get periodic updates on these and other metrics. There are a number of different ways to accomplish this but I wanted to demonstrate an easy and extensible solution to this using Apache Nifi. This solution uses out of the box processors in the Nifi library and leverages Slack as a broader notification medium as opposed to email.
If you haven’t used Apache Nifi before, it’s a brilliant application for moving data or files and coordinating tasks. Users build drag-and-drop directed graphs called workflows comprised of out of the box “processors”. The platform is open so it’s a fairly easy task to build custom processors as well if you so choose. There’s a bit of a learning curve at first but it’s well worth the investment of time.
Installing and running Apache Nifi in 3 easy steps.
Nifi requires Java so make sure you have that installed and it’s in your PATH
- Download Nifi (not the Nifi toolkit) from the Apache website. 1.11.1 is the latest version (as of 2/17/2020).
- Unpack the download
- Open a terminal and run <NIFI_HOME>/bin/nifi.sh start (or the run-nifi.bat if you use Windows)
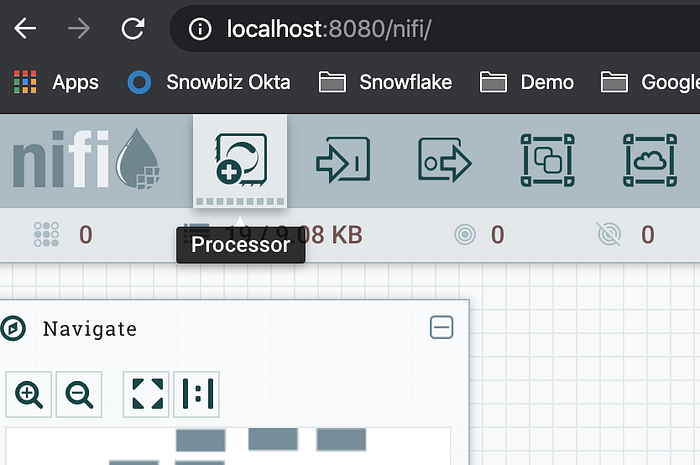
That’s it. Give it a minute to run the start up then open a browser window and go to http://localhost:8080/nifi. If you have a port conflict you can adjust the Nifi port by modifying the nifi.web.http.port in the nifi.properties file found in the /config directory in NIFI_HOME. Just run nifi.sh stop to shut it down.
Solution preparations
Before we dive into building the pipeline in Nifi, let’s first set up a couple of things this solution will depend on. We will create a control table in Snowflake to store the metrics and threshold values and secondly we need to define a custom Slack application in order to expose an incoming webhook which we will use to post messages.
Creating your monitoring thresholds table
This is the table you will join your resource queries against to see if you are going over your configured threshold. You can create this table in any DB/Schema.
CREATE TABLE “MY_TEST_DB”.”PUBLIC”.”THRESHOLDS” (“SERVICE_TYPE” STRING NOT NULL, “CREDITS_BILLED” DOUBLE NOT NULL) COMMENT = ‘Used for the Nifi alerting demo’;
Then inset some sample records. This specifically uses the 4 metrics we will compare against but this can be expanded to include additional metrics.
insert into “MY_TEST_DB”.”PUBLIC”.”THRESHOLDS” values (‘AUTO_CLUSTERING’, 10),(‘PIPE’, 10),(‘MATERIALIZED_VIEW’, 10),(‘WAREHOUSE_METERING’, 10);
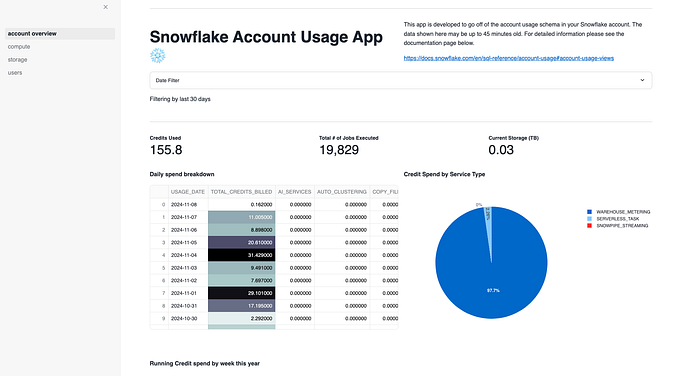
You can test your table by running the following query. This will be the query we use to monitor resource consumption.
select a.*, iff(b.credits_billed is null, 0, b.credits_billed)::string as credits_billed from
“MY_TEST_DB”.”PUBLIC”.”THRESHOLDS” a left join
(select service_type, sum(credits_billed::double) as credits_billed from “SNOWFLAKE”.”ACCOUNT_USAGE”.”METERING_DAILY_HISTORY” where usage_date=current_date() group by 1) b
on a.service_type = b.service_type;
Creating a Slack Application and the incoming webhook
Follow the steps here for creating your Slack app which will provide the connectivity needed to post messages to your Slack channel for monitoring. You will note that in the configuration of this app you will designate the Slack channel this will communicate over. Keep this in mind as it will be referenced later in this article. Once your app has been created and you have the Webhook URL in hand, it’s time to start building the pipeline.
Building your Snowflake monitoring pipeline
There’s a link at the end of this article that will allow you to download and import a template of the workflow. It’s good to review the steps here because you will need to modify the template but there’s no need to execute these step by step if you don’t want to.
When you first log into Nifi you should see a blank canvas. This is where you will bring processors and then configure and link them together. Since our workflow will require querying from Snowflake lets first define a JDBC controller service. This service can then be used by multiple processors when talking to Snowflake
Creating a Snowflake JDBC Connection pool service
- Right click anywhere on the canvas. A pop up menu should appear and select “configure”. A new “Nifi Flow Configuration” window should appear. Select the “Controller Services” tab then click the plus button on the right edge. The “Add Controller Service” window appears. You can scroll down to DBCPConnectionPool in the list of services or use the filter box. Highlight this service and click the “Add” button in the bottom right.
- Back in the “Controller Services” tab you should now see the new service. Click the gear icon on the right side of the screen to configure it. A pop up “Configure Controller Service” window opens. Change the default name to something like “GlobalSnowflakeConnection” and click the properties tab. Here you will complete the details to connect to your Snowflake account
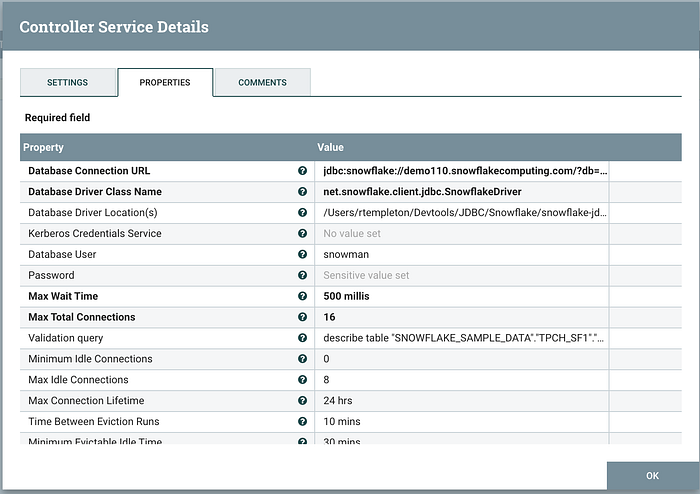
- Database Connection URL: The JDBC connection string for connecting to your account. I advise including the optional warehouse and role parameters. These can be overridden later in your workflow. See the documentation here for details https://docs.snowflake.net/manuals/user-guide/jdbc-configure.html#jdbc-driver-connection-string
- Database Driver Class Name: net.snowflake.client.jdbc.SnowflakeDriver
- Database Driver Location: The full path to the Snowflake JDBC .jar file
- Database User and Password: Make sure the user specified has the proper role to access the ACCOUNT_USAGE data in your Snowflake account.
- Set the remaining settings based on this example. These primarily deal with making sure connections in your pool don’t go stale.
4. Click Apply to save your settings and exit the config window.
5. Back in the Controller Services window, click the lightning bolt icon for the service you just configured to enable this connection pool service. If there’s a misconfiguration, the service will fail to start and you will be alerted.
Building the Snowflake monitoring pipeline
You build pipelines in Nifi by adding processors to the canvas and linking them together. Each processor is responsible for performing some discreet operation then optionally passing its payload to downstream processors. Add a new processor by clicking and dragging the processor icon from the toolbar onto the canvas.
The add processor window opens and you are prompted to pick the type of processor you want to add. Use the filter in the top right corner to filter by name or tag (functionality). For this workflow select “Execute SQL” and click Add.
Back on the main canvas, double click the processor to configure it.
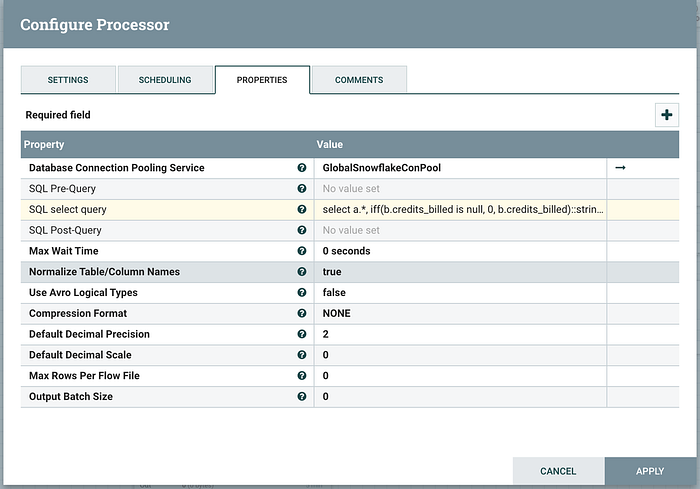
Database Connection Pooling Service: Pick the service you created in the previous step.
SQL select query: cut and paste the query from above that was used to test the threshold table.
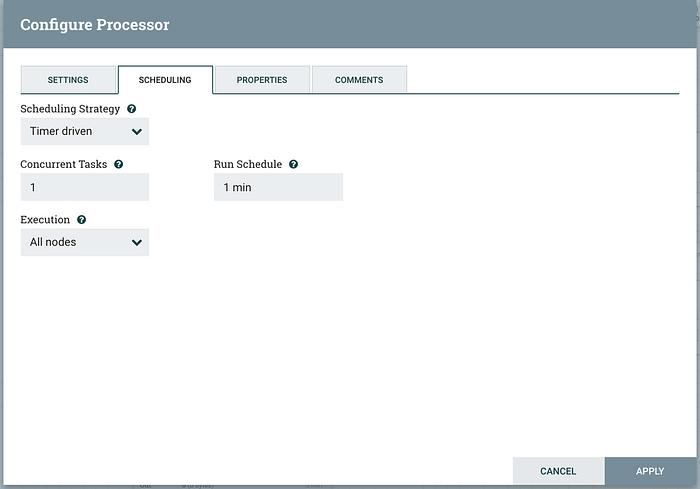
Nifi processors run continually by design (as in a true Dataflow processing architecture) but in our case we don’t want this processor to execute over and over non-stop. For our testing purposes, set this to “1 min”.
Lastly, in the settings tab we need to terminate the failure relationship. Relationships are like ports on processors. Depending on what a given processor does, the work product of that process is sent to the a specific output port (relationship). In this pipeline we only need to read data from the “success” port, so failure needs to be terminated. You will see this pattern of terminating unused relationships in the other steps in the pipeline. Click apply to save your changes and close the configuration window.

Back on the canvas add another processor of type ConvertAvroToJSON. As you can see in the documentation, the first ExecuteSQL processor will run the query in Snowflake but the result set is converted to Avro. This processor will convert the payload to JSON so it can be manipulated downstream.
If you mouse over the first processor, you will see an arrow icon appear in the middle of the processor. Drag this to the second processor and a new window will appear.
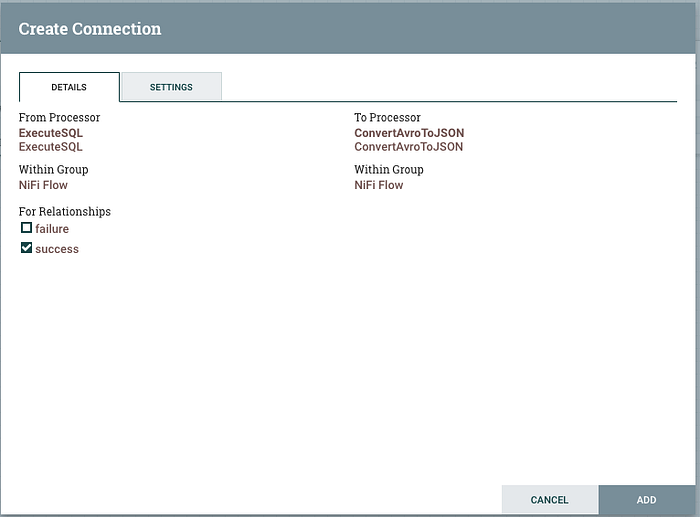
Select the “success” relationship, this is the output queue we are using to link the two processors. Click Add to complete the configuration and close the window. You’re Nifi canvas should now look like this:
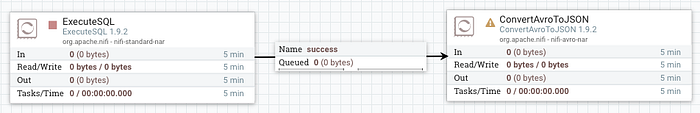
The stop icon in the ExecuteSQL processor indicates that it has no configuration issues but isn’t running. Right click it and select “Start” from the pop up menu. The processor will execute and after a short while you will see the output appear in the success relationship.
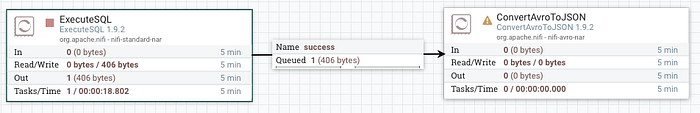
At this point right click the ExecuteSQL processor and pick Stop. Remember we previously set the schedule to run every minute so if we don’t stop it, it will continue to execute the query every minute. Let’s inspect the message payload (aka Flow File).
Right click the success relationship and select list queue from the pop-up.
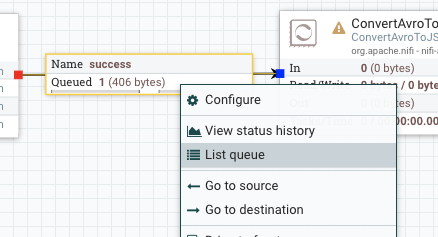
A new window appears with the one Flow File listed. Click the “i” icon to the left of the entry to drill into the details of flow file. Information about this file is available in both the “details” and “attributes” tabs. Note the attributes that are listed here. We will refer to some of this information later on.
Back on the details tab, click the “view” button to see the contents of the flow file. This will open a new tab in your browser. As previously mentioned this is an Avro formatted file so the viewer may show some weird characters because this is binary data.
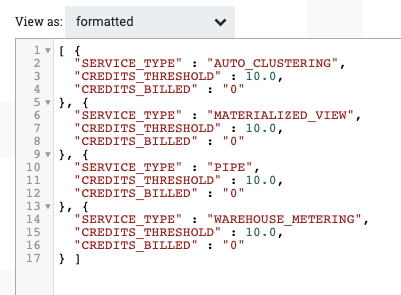
Select “formatted” from the “view as” drop down menu near the top left to see this rendered in JSON. The results should look something like this. Close this viewer window and the other modal pop-up windows to get back to the canvas.
Add a JoltTransformJSON processor to the canvas and create a “success“ relationship from the previous ConvertAvroToJson to this new processor. Don’t forget to open the ConvertAvroToJson processor and terminate the “failure” relationship. This processor requires no further configuration. Next double click the JoltTransformatJSON processor. This processor lets us apply a JOLT transformation to the JSON flow file. We need to modify the results of the query and format it into the message that will be sent to Slack.
Here are the links to further documentation on using Jolt and Block Kit in Slack.
Apply the following Jolt transformation into the processor config:
[{“operation”:”shift”,”spec”:{“”:{“SERVICE_TYPE”:”blocks[1].fields[].text”,”CREDITS_BILLED”:”blocks[1].fields[].text”}}},{“operation”:”default”,”spec”:{“blocks[]”:{“0”:{“type”:”section”,”fields[]”:{“0”:{“type”:”mrkdwn”,”text”:”SERVICE TYPE”},”1":{“type”:”mrkdwn”,”text”:”CREDITS USED”}}},”1":{“type”:”section”,”fields[]”:{“”:{“type”:”plain_text”}}}}}}]
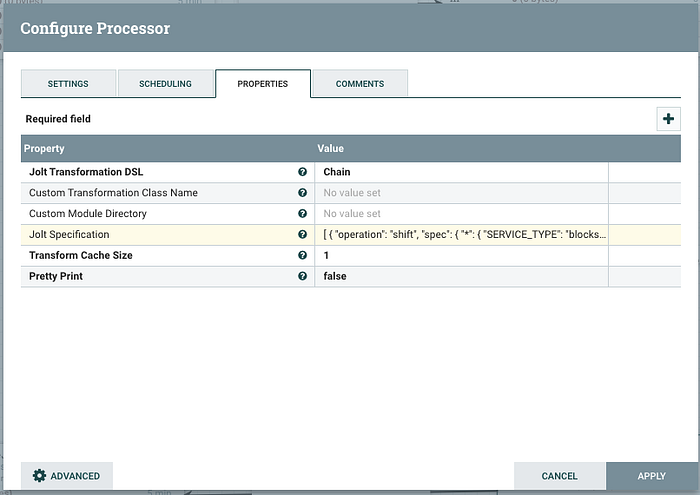
In the “Settings” tab, be sure to terminate the “failure” relationship then click Apply to save and close the window.
Only two more processors to add and configure before the workflow is complete! Let’s add both of those right now. Add an “EvaluateJsonPath” and a “PutSlack” processor on the canvas then double click “EvaluateJsonPath” to open the configuration. Nifi has an internal scripting language to help with routing and other logical tasks you want to perform on Flow Files. Documentation on this here. This processor will need to move the payload of the flow file into an Attribute so we can refer to this using the Expression Language syntax. Complete the configuration as:
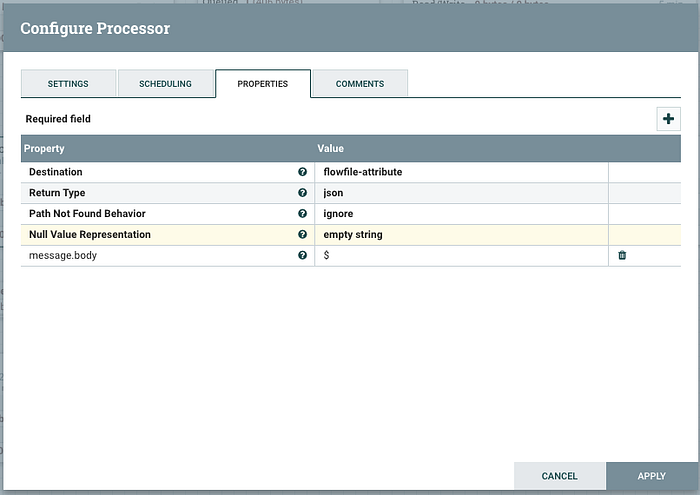
Note! You will need to click the plus button in the right corner of this window to add the custom “message.body” attribute. After the property name is added you can then add the “$” (JSON path reference to the message body) and complete the config. In the settings tab be sure to terminate the both the “failure” and “unmatched” relationships. Click apply to save and close the window.
Now double click the PutSlack processor:
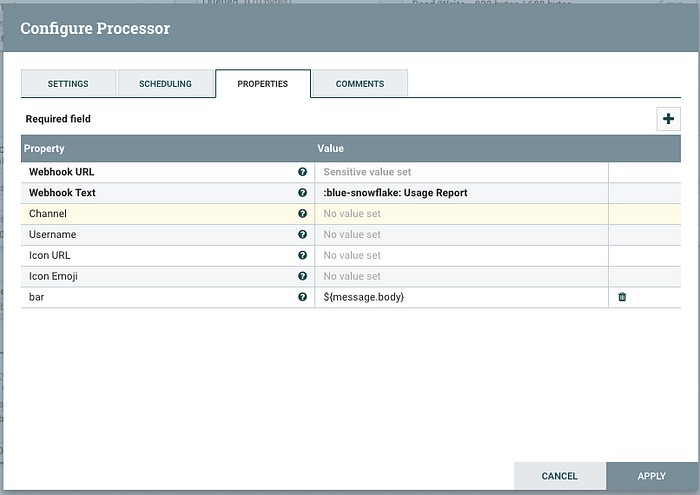
Cut and paste the Webhook URL previously created into the first property. The Webhook Text is just plain text so I used this essentially as the title of message. I threw in an emoji reference here too as you can see. Lastly, click the plus sign to add a custom property. This processor will attach the contents of all custom properties to the message. In our case we want that to be the JSON formatted message that we previously added to the list of attributes. In the settings tab terminate both the “success” and “failure” relationships since his is the last processor in the flow. Note: Although the config window contains a Channel property I was not able to override the default Channel setting when I created the Slack app. It appears the channel on which the message will be broadcast can only be changed by the app definition in Slack.
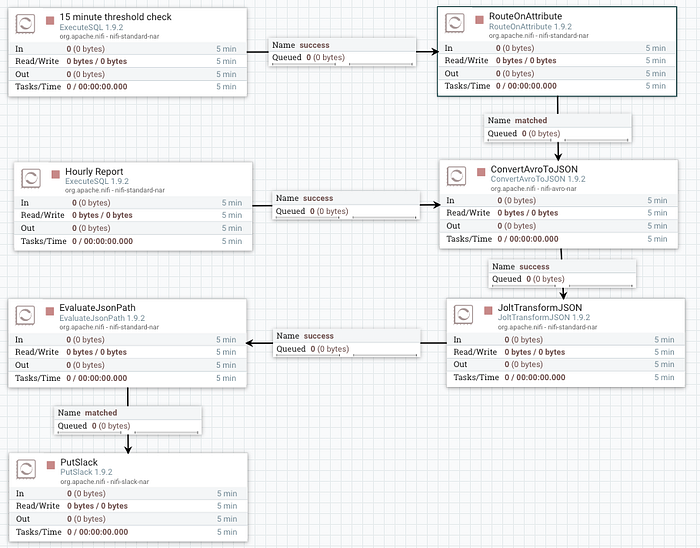
Finish linking the processors together and you should see something like this
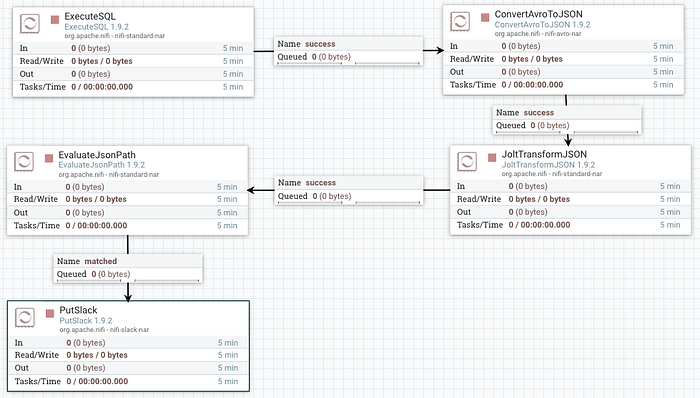
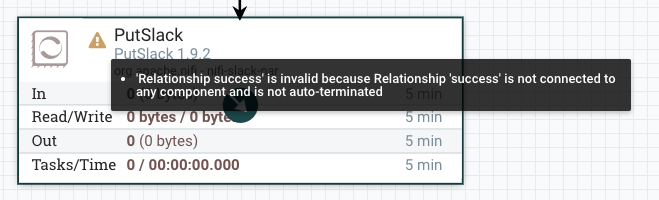
If you don’t see the stop Icon in each processor, you can mouse over the yellow warning icon to see the configuration problem with this processor. Most times this is due to an improperly terminated relationship but can also be any other configuration issue.
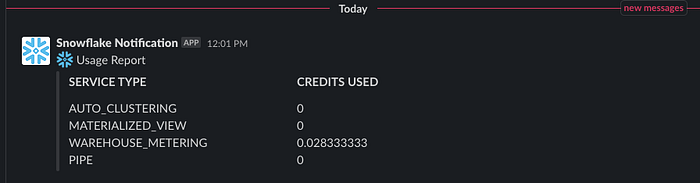
Click play on each of the processors to start the workflow. If there are no problems you should see a new alert message pop-up in the designated Slack channel similar to this:
If you do encounter a problem the right top corner of the offending processor will turn red. You can click on that to see a brief message of the problem. To see a detailed message (the full stack trace from the processor) go to <NIFI_HOME>/logs/nifi-app.log. You may want to stop the ExecuteSQL processor before troubleshooting otherwise it will continue to run the query every 1 minute.
Updating the workflow to run on a schedule
If you haven’t done so already, stop the ExecuteSQL processor. Originally we configured this to run once a minute which is fine for development but we don’t want to spam the channel with updates every minute. Double click the processor and go to the scheduling tab:
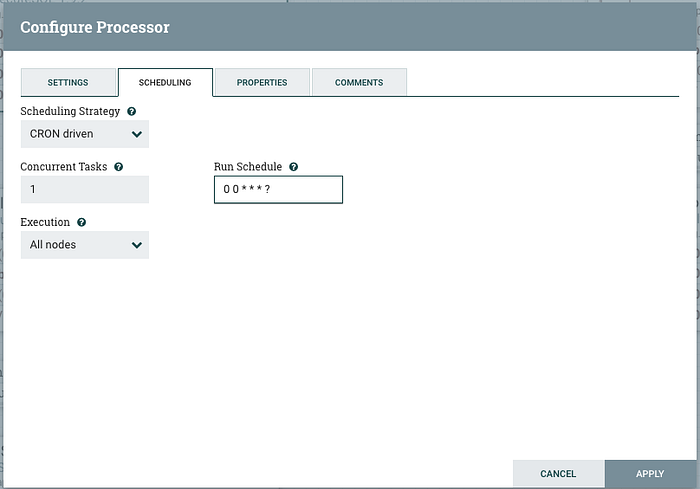
We will set this to a CRON based scheduler and configure it to run at the top of every hour to send a general usage report. Click apply to save the change and then restart the processor and your new Snowflake resource monitoring pipeline is running.
Other options for this pipeline
At this point you have a pipeline in place to keep folks up to date on credit consumption within their Snowflake account. You can add additional services you wish to monitor by modifying the SQL query. Keep in mind that changes to result set column names will require changes to the Jolt transformation as well.
The pipeline above will send out a general purpose credit consumption report hourly, but we could extend that to also check every 15 minutes to see if any particular metric exceeds it threshold and report on that.
Copy and paste the existing ExecuteSQL processor right there on the canvas and double click to configure it.
In the configuration change the “SQL Select query” to this which will only return results where the actual usage is over the threshold:
select service_type, credits_billed from (
select a.*, iff(b.credits_billed is null, 0, b.credits_billed)::string as credits_billed from
“MY_TEST_DB”.”PUBLIC”.”THRESHOLDS” a left join
(select service_type, sum(credits_billed::double) as credits_billed from “SNOWFLAKE”.”ACCOUNT_USAGE”.”METERING_DAILY_HISTORY” where usage_date=current_date() group by 1) b
on a.service_type = b.service_type
) where credits_billed > credits_threshold
In the Scheduling tab, set the strategy to CRON and modify the run schedule:

Click apply to save the settings and close the window.
Next add a “RouteOnAttribute” processor. We will use this as a filter to pass along any flow files that meet our criteria which in this case is a result set that has more than 1 record.
Configure the process as so:
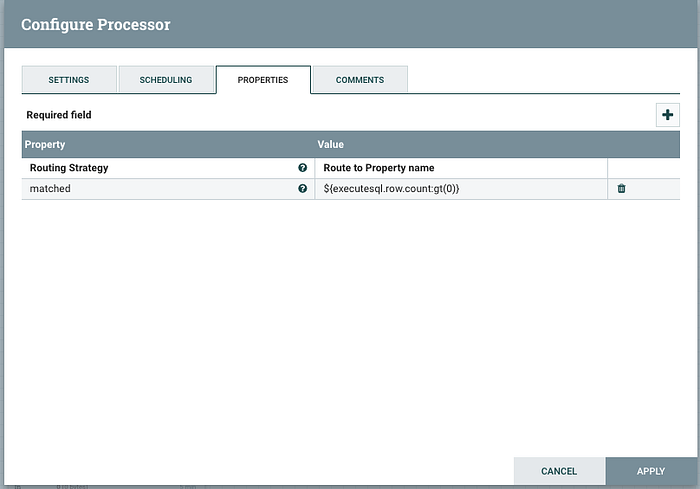
You will need to click the plus icon in the top right corner to add the new property. The value uses Nifi Expression Language to check the flow file attribute “executesql.row.count” for a value greater than zero. Link the “matched” output from this processor to the ConvertAvroToJson processor. The end result should now look something like this:
TL;DR
This article walks you through installing and running Nifi in you local environment then building out a workflow to monitor Snowflake credit consumption and report those results to a Slack channel. You can download a template of this workflow here and the SQL source code mentioned in this available here.